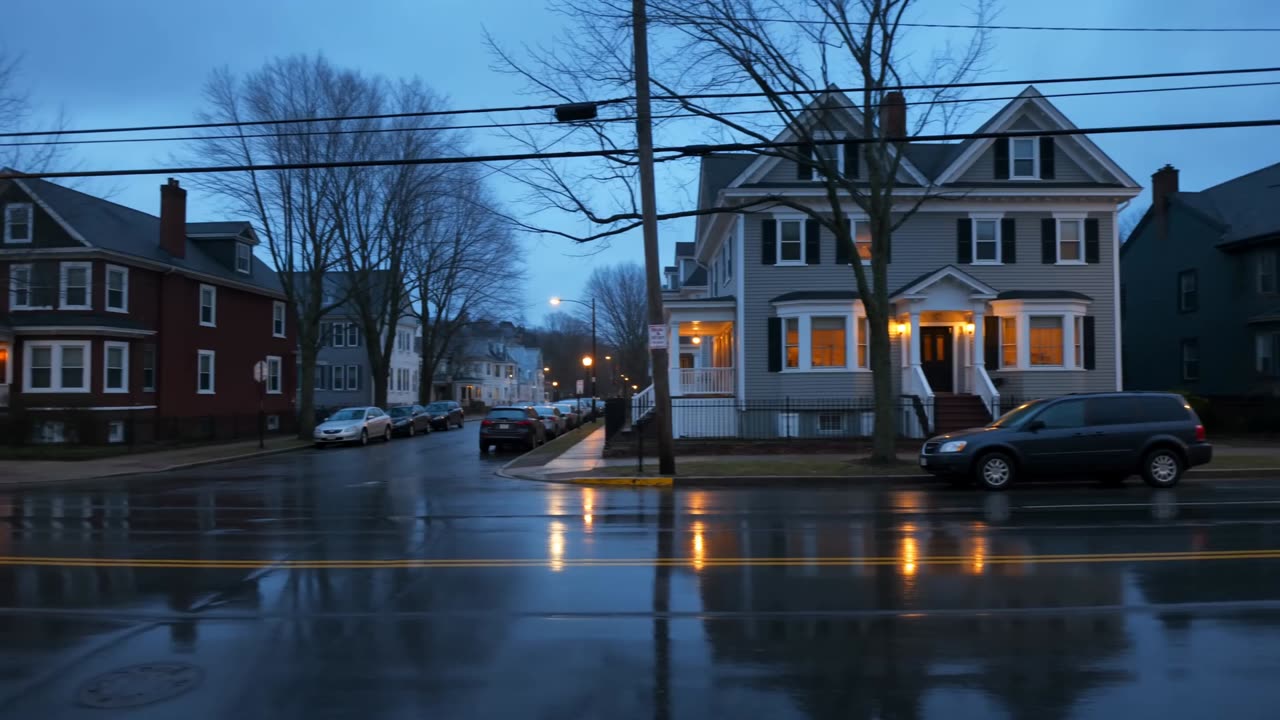
A neighbourhood, corrected
West Cambridge loses the most trees in the city. Almost none of it is development.
The obvious story writes itself: the neighbourhood with the most redevelopment also removes the most trees. The City's own reason codes say otherwise, and the correction is more interesting than the story.
Units proposed, West Cambridge
Thirteen neighbourhoods, shaded light to dark by units proposed.
The year is the year the permit was issued, not the year the tree came down — the record publishes no removal date at all, so a count of trees removed in a year cannot be built from it. A count, not a rate. The neighbourhood with the most removals also holds the city's densest canopy — a removal count largely tracks how many trees a neighbourhood has, so reading this as where the harm lands reads it backwards. The specification asks for every removal drawn as its own crown polygon; no crown diameter is published for any removed tree, and a removal maps to one household, so this is the finest resolution the record supports.
The two facts that look like a story
West Cambridge records 730 tree removal permits since 2019 — more than any other neighbourhood. It also holds the densest tree canopy in the city, 33.4% of its 787.4 acres.
And it carries 19 redevelopment projects, 12 of which state a unit count, proposing 139 homes where 30 stand.
Put those beside each other and the conclusion seems obvious. It is worth resisting, because the record does not support it.
Where the ten-unit projects are
Thirteen neighbourhoods, shaded light to dark by units proposed.
The year is the year the permit was issued, not the year the tree came down — the record publishes no removal date at all, so a count of trees removed in a year cannot be built from it. A count, not a rate. The neighbourhood with the most removals also holds the city's densest canopy — a removal count largely tracks how many trees a neighbourhood has, so reading this as where the harm lands reads it backwards. The specification asks for every removal drawn as its own crown polygon; no crown diameter is published for any removed tree, and a removal maps to one household, so this is the finest resolution the record supports.
8 removals of 631 are development
Every removal permit carries a reason. Of the 631 West Cambridge permits that state one, 495 — 78% — are recorded as dead or dangerous. 8 are recorded as project impact. That is 1.3%.
Removals are also flat: the yearly count has not risen since 2019, including after the 2025 rezoning.
So the honest reading is almost the opposite of the obvious one. West Cambridge removes the most trees because it has the most trees, and most of them are being removed because they are dying. This is an old neighbourhood with an old canopy, and an old canopy is one that dies.
Tree canopy by neighbourhood
Thirteen neighbourhoods, shaded light to dark by percent canopy cover, 2018.
The year is the year the permit was issued, not the year the tree came down — the record publishes no removal date at all, so a count of trees removed in a year cannot be built from it. A count, not a rate. The neighbourhood with the most removals also holds the city's densest canopy — a removal count largely tracks how many trees a neighbourhood has, so reading this as where the harm lands reads it backwards. The specification asks for every removal drawn as its own crown polygon; no crown diameter is published for any removed tree, and a removal maps to one household, so this is the finest resolution the record supports.
What that does and does not settle
It does not mean the canopy is safe. Between 2014 and 2018 West Cambridge lost 30.6 acres of canopy on net — the largest loss of any neighbourhood, and it happened without development being the cause.
It also does not mean the question is closed. Nobody has measured Cambridge's canopy since 2018. The rezoning came seven years later, so no published canopy figure describes the city these projects are being built into. A reason code records why a permit was issued; it does not record what a foundation does to a root system on the next lot.
What it does settle is that the removals already on record are not the evidence. Anyone arguing either side from this dataset is arguing from 1.3%.
Removal permits by neighbourhood
Thirteen neighbourhoods, shaded light to dark by removal permits, 2019 to 2025.
The year is the year the permit was issued, not the year the tree came down — the record publishes no removal date at all, so a count of trees removed in a year cannot be built from it. A count, not a rate. The neighbourhood with the most removals also holds the city's densest canopy — a removal count largely tracks how many trees a neighbourhood has, so reading this as where the harm lands reads it backwards. The specification asks for every removal drawn as its own crown polygon; no crown diameter is published for any removed tree, and a removal maps to one household, so this is the finest resolution the record supports.
Why we published the correction rather than the story
The version of this page we drafted first put the removal count and the redevelopment count side by side and let the reader draw the line between them. It would have been read as a finding. It would have been wrong, and the reason field would have been quoted back at us within a day.
A count and a count next to each other is not evidence of anything. This is the check we apply to every figure here, and it is worth showing the one time it changed the headline.
Both numbers stay published, on the tracker, with their reasons and their gaps. What is not published is the sentence joining them.