Every city has a public record. Almost nobody can read it.
Permits. Budgets. Hearings. Elections. Canopy. Flooding. Rents. The facts that decide how a place changes are already public, sitting in a dozen systems nobody reads. 360citi puts them in one place, in plain language, and shows where every number came from.
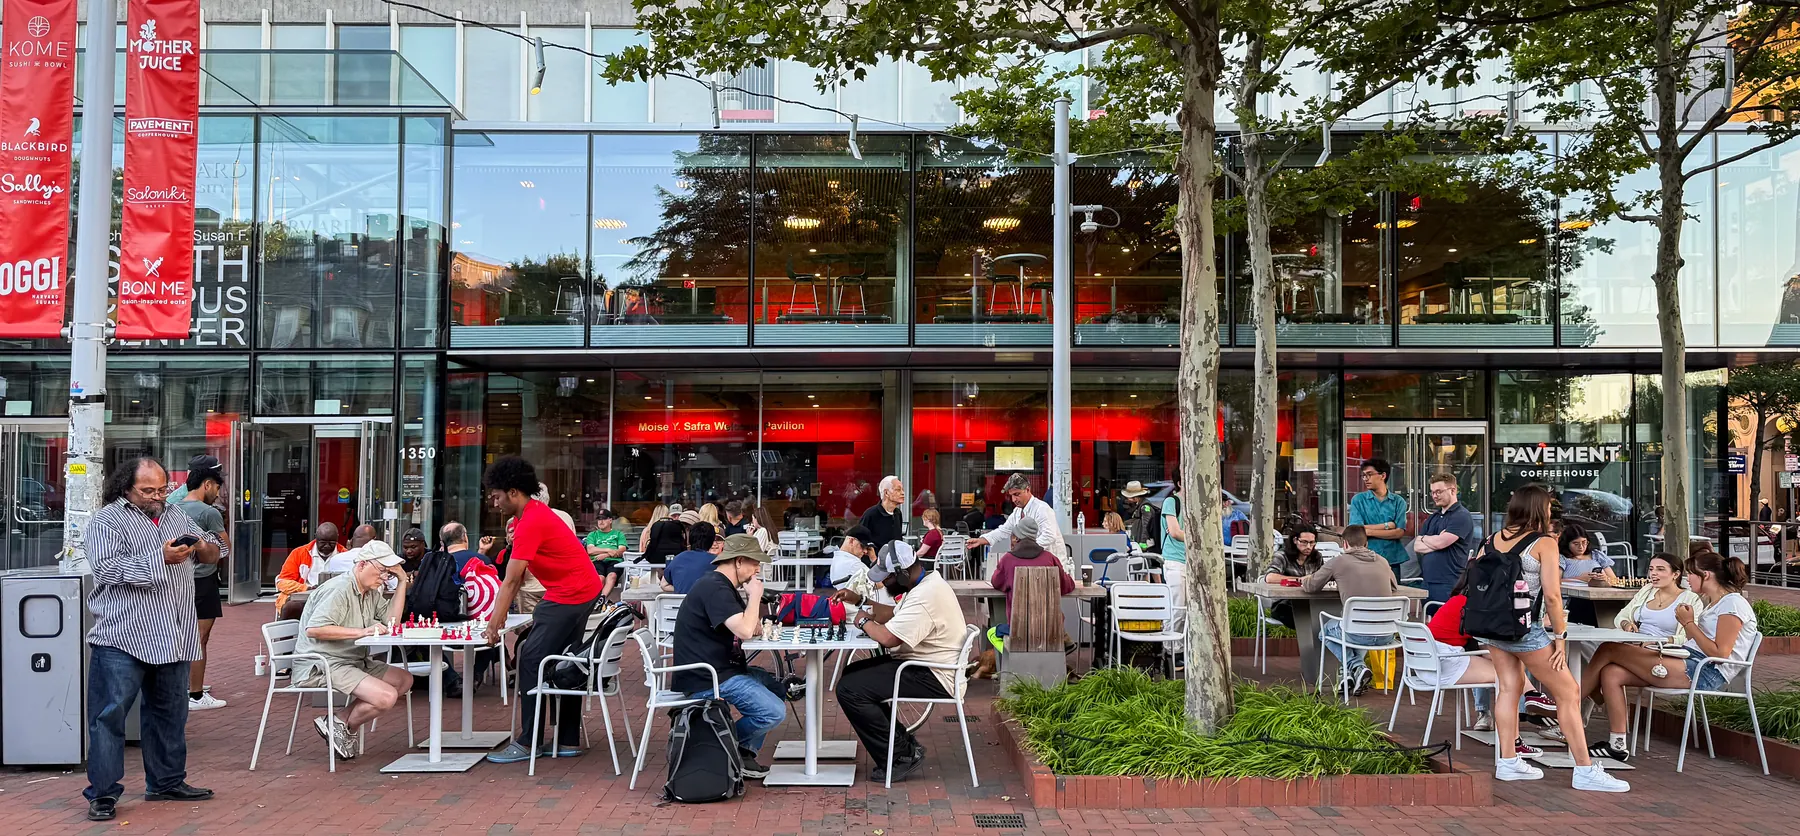
Public places in Cambridge: a café terrace under awnings, a green with a ballfield, a bike-share dock, park paths and office towers.
Where the numbers come from
Every number shows where it came from. When a city does not publish one, the page says so.
That way anyone can check a figure against the original record before relying on it.
01 · The method
What ports between cities
Provenance on every figure
Each number carries its publisher, the date on the source and when we last read it. It is marked as one of six states, from fact to disputed to missing, and only two of those count as fact.
Gaps you can ask about
A missing figure names the office that holds the record, so a resident knows where to ask for it.
Aggregates, never residents
City feeds carry names and street addresses. We ask the publisher for totals only, so no record about a single household is downloaded or kept.
Funding that cannot buy an answer
Membership and donations. No advertising. No sale of resident data. No developer paying for analysis. If that ever changes, the site says so before it changes.
Community impact, before it happens
When a large facility is proposed, the question a neighbourhood asks is not whether it is lawful. It is what this will do to us, and who it reaches first.
The Community Wellbeing Index scores every parcel in a city across eight themes: economic, education, environment, infrastructure, health, housing, safety and social. Then you put a proposed development on the map. The index recomputes the parcels around it and shows you which households absorb the cost, one parcel at a time, measured against the real baseline rather than a forecast.
We wrote the specification in July 2026, for a data centre, a pipeline, a power plant, a transmission line, a big-box store. Any single facility that changes several things at once for the homes nearest it.
One of the eight themes has no data in the city it covers today, so it is left empty. Parcels that matched no record are counted separately.
- 34,788
- parcels scored
- 8
- wellbeing themes
- 1
- theme shown empty, not imputed
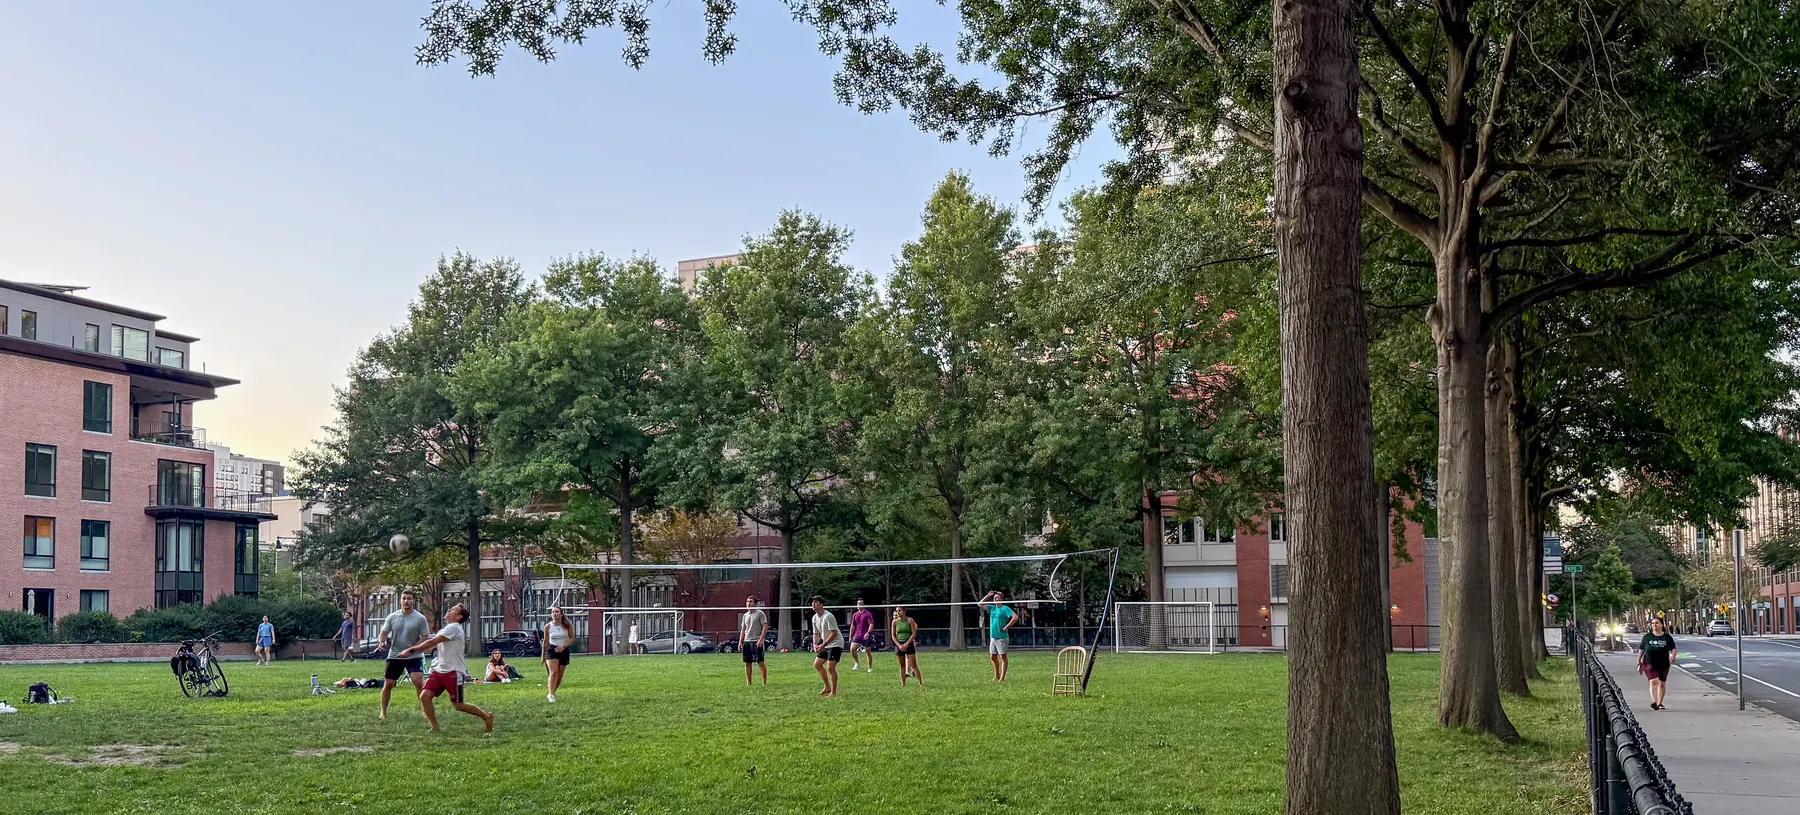
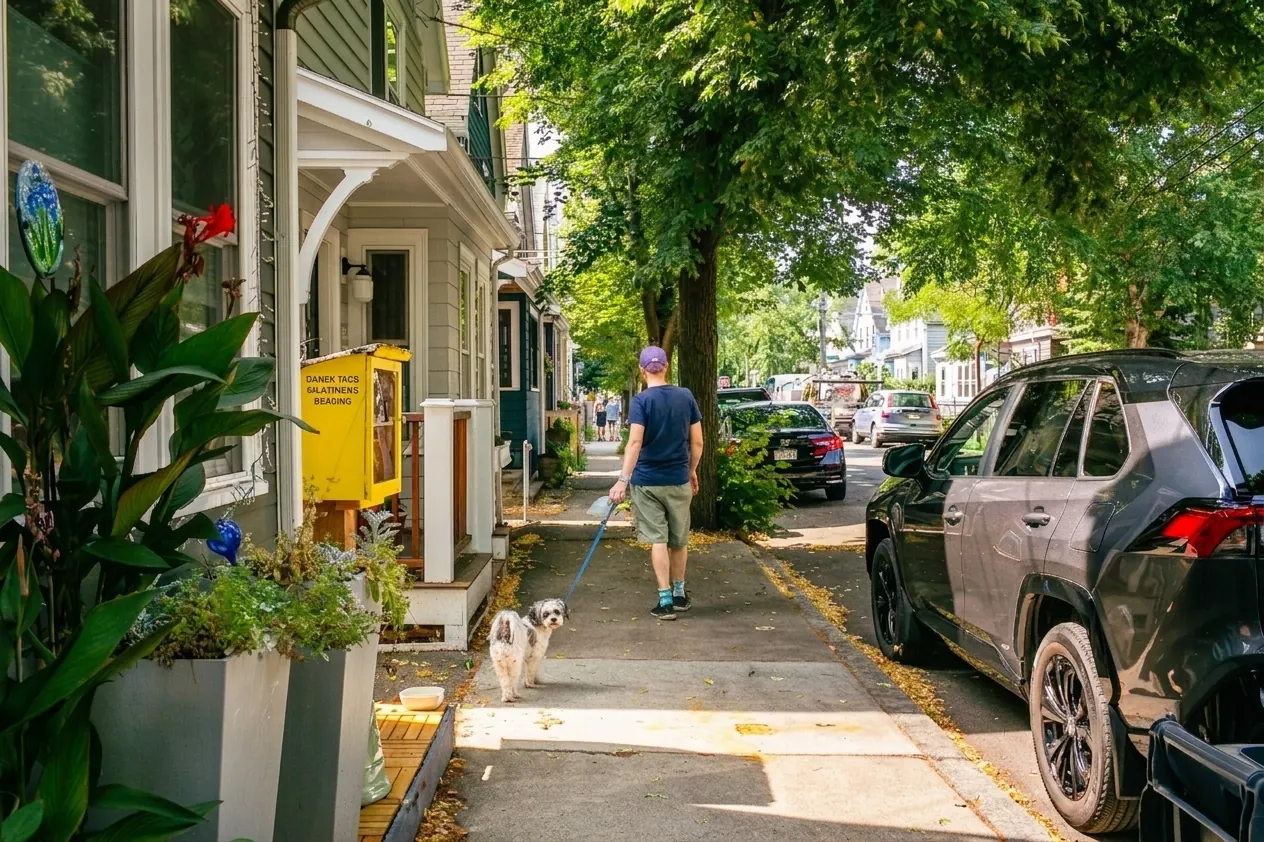
Cambridge streets in use: people walking past shopfronts and a hardware store, a bike path, a playground and a planted plaza.
02 · What a city gets
What a city gets
Not a report that ages on a shelf. A public record that keeps updating, and that anyone can read without an account.
8
public trackers
Canopy and heat, rainfall and flooding, affordability, housing, voting, development. Each names what it measures and what it refuses to conclude.
921
public meetings, 2022–2026
Across 84 boards, assembled from a municipal portal that publishes no API. Where the city has posted nothing ahead, the calendar says so rather than looking quiet.
7 of 8
affordability measures sourced
The eighth is published as missing, naming the record that would answer it. That measure is the point: it is what a record that refuses to guess looks like.
13
neighbourhoods, each with a room
Residents post under their own names, moderation rules are published, and the neutral record stays separate from the argument about it.
Figures for Cambridge, Massachusetts.
03 · Where it runs
Where it runs today
Two cities today, each using a different part of the platform.
Cambridge, Massachusetts
The full civic record. Trackers, the meeting calendar, an address lookup down to the parcel, an affordability record, and a forum with a room for every neighbourhood.
See the Cambridge recordOpen to read, no account needed.
Portsmouth, Virginia
The Community Wellbeing Index and its development simulator, computed over every parcel in the city.
Bringing it to another city
Talk to us about your city
All it takes is data a city already has: a parcel file, a permit feed, a meeting record. Most cities hold all three and publish none of them in a form anyone can use. Turning that into a record residents can read is the work, and it is the same work every time. That is why it travels.
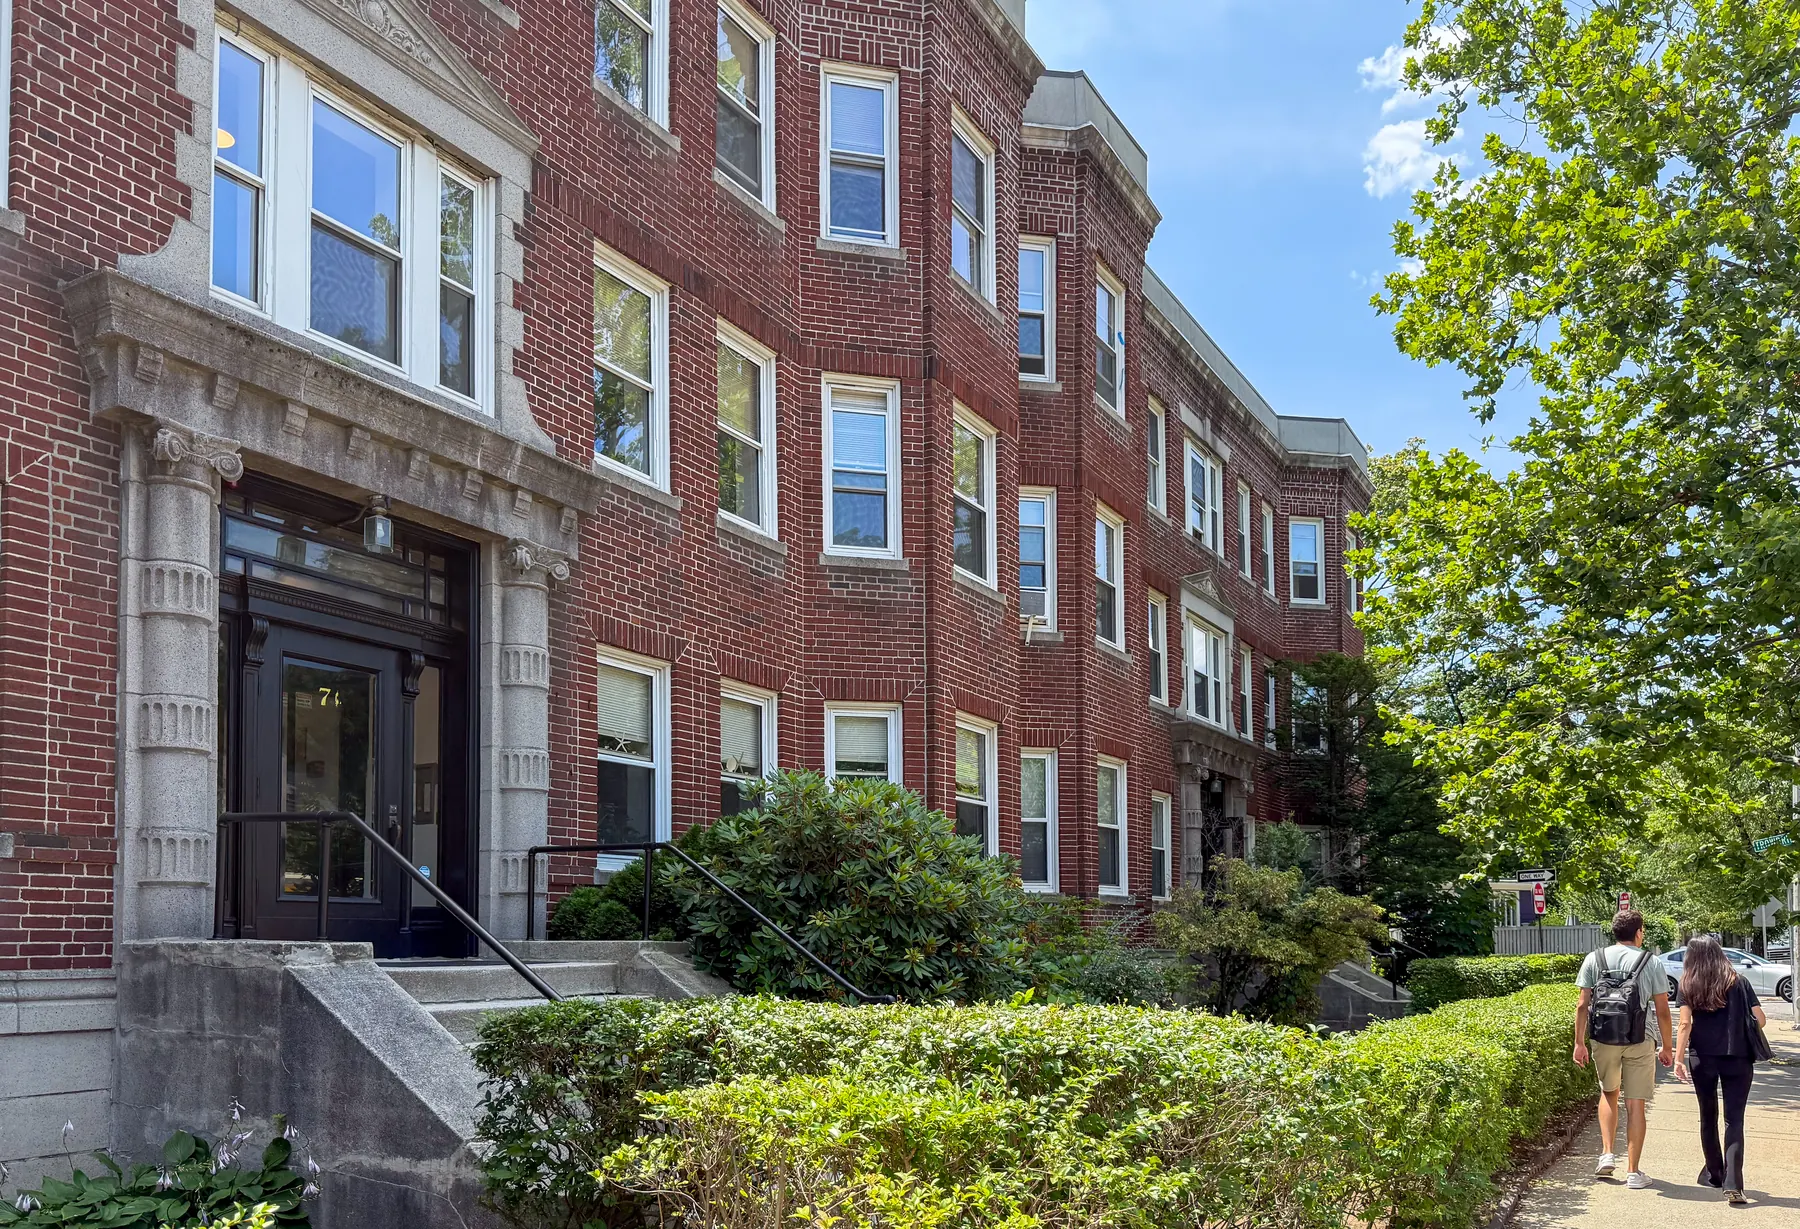
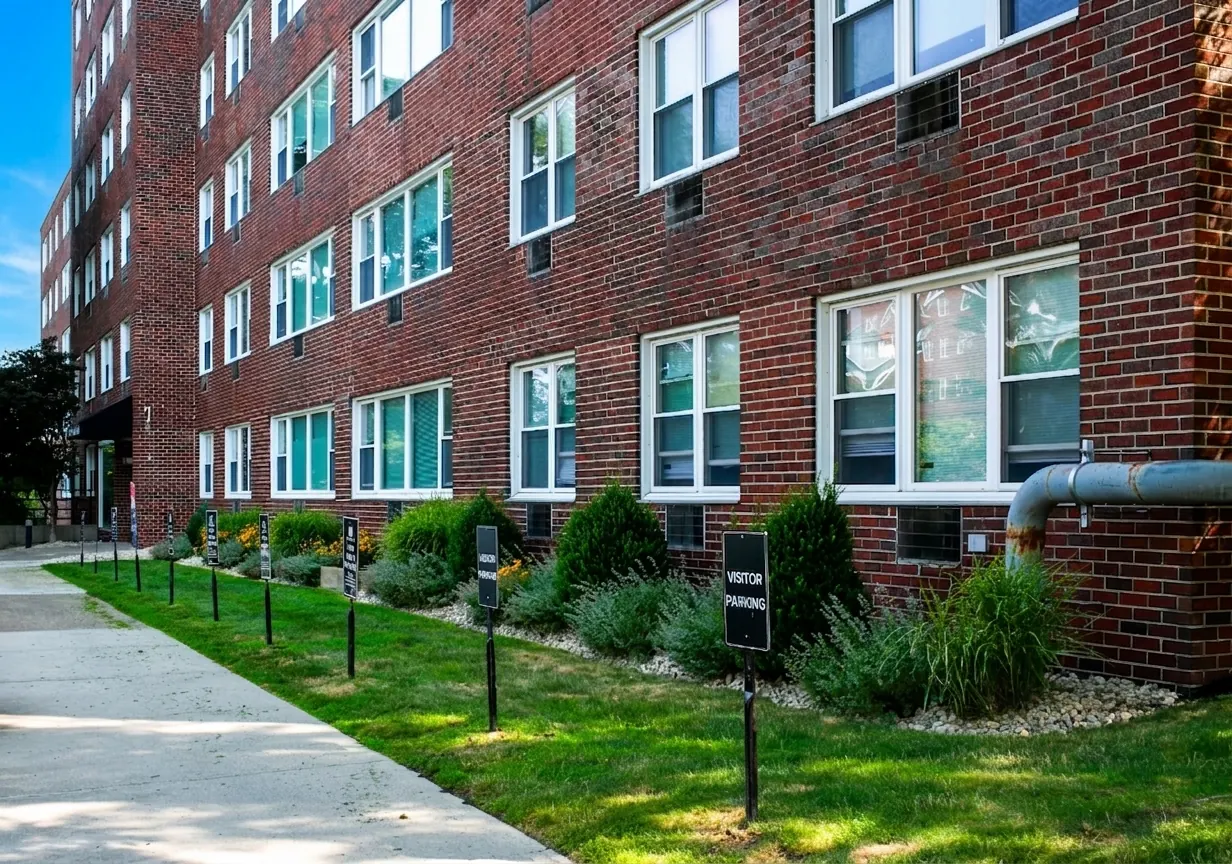
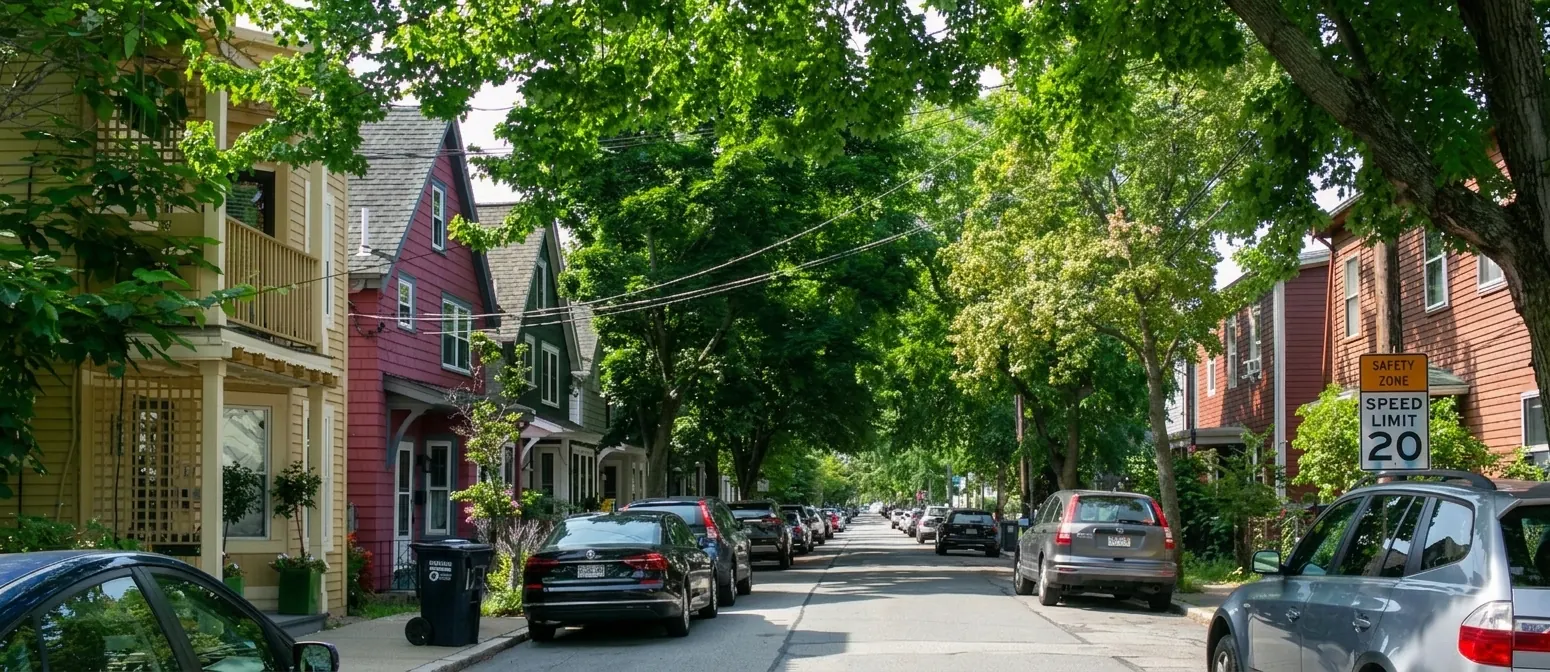
Cambridge housing: brick apartment blocks, triple-deckers, clapboard houses and tree-lined residential streets.